Frequently Asked Questions
Yes. The work has been performed in a wholly independent manner, with no funding or grants from any company or organisation. The goal was, and always will be, to accurately compare the different drug regimens. The work has now been published in the highly regarding Journal of Clinical Pharmacology and Therapeutics. The title (with link to PDF), citation and abstract are shown below.
A Model-Based Meta-Analysis of 24 Antihyperglycemic Drugs for Type 2 Diabetes: Comparison of Treatment Effects at Therapeutic Doses.
Maloney A, Rosenstock J, Fonseca V
Clin Pharmacol Ther. 2018 Nov 20. doi: 10.1002/cpt.1307
Model-based meta-analysis was used to compare glycemic control, weight changes, and hypoglycemia risk across 24 antihyperglycemic drugs used to treat type 2 diabetes. Electronic searches identified 229 randomized controlled studies comprising 121,914 patients. To ensure fair and unbiased treatment comparisons, the analyses adjusted for important differences between studies, including duration of treatment, baseline glycated hemoglobin, and drug
dosages. At the approved doses, glycemic control was typically greatest with glucagon-like peptide 1 receptor agonists (GLP-1RAs), and least with dipeptidyl peptidase-4 (DPP-4) inhibitors. Weight loss was highly variable across GLP-1RAs but was similar across sodium-glucose cotransporter 2 (SGLT2) inhibitors. Large weight increases were observed with sulfonylureas and thiazolidinediones. Hypoglycemia risk was highest with sulfonylureas, although gliclazide was notably lower. Hypoglycemia risk for DPP-4
inhibitors, SGLT2 inhibitors, and thiazolidinediones was generally very low but increased slightly for both GLP-1RAs and metformin. In summary, important differences between and within drug classes were identified.
The ADA position statement "Pharmacologic Approaches to Glycemic Treatment: Standards of Medical Care in Diabetes - 2019" provides excellent advice on the different treatments for patients with type 2 diabetes. A link to the document is provided below, along with a reproduction of their Table 9.1, which compares the different drug classes.
Pharmacologic Approaches to Glycemic Treatment: Standards of Medical Care in Diabetes—2019
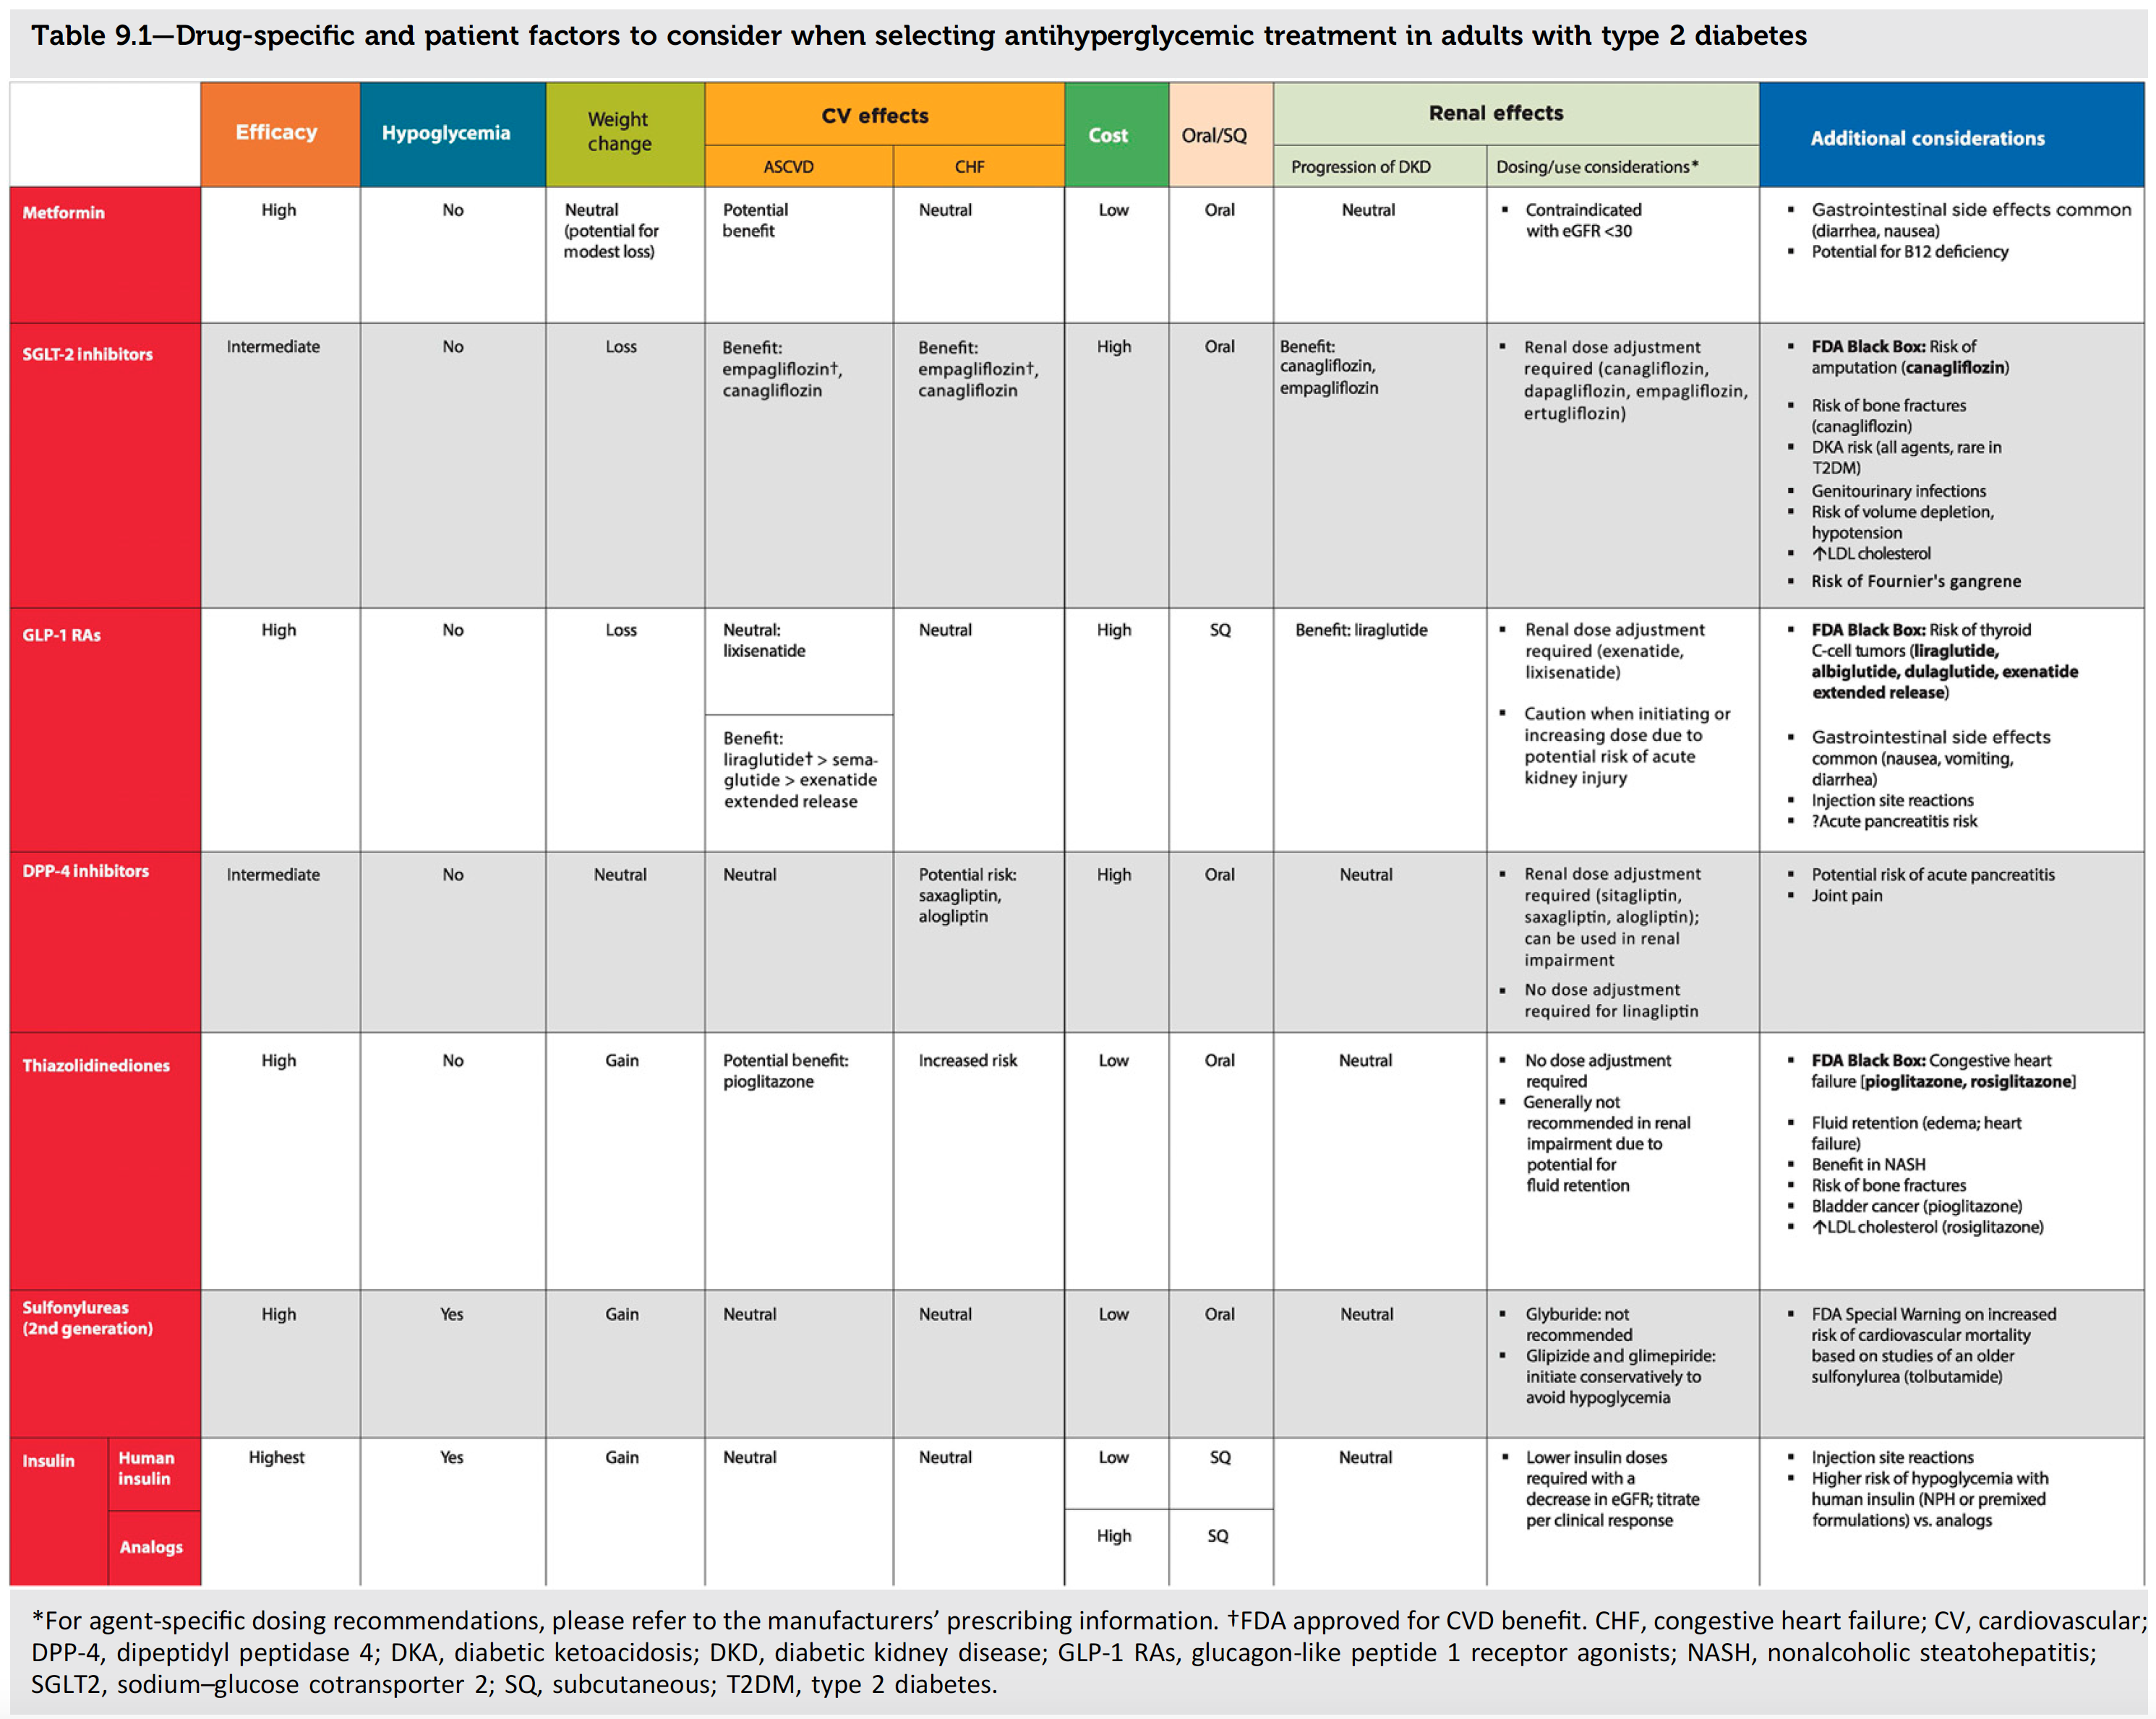
Our work concerns the first three columns: Efficacy, Hypoglycemia and Weight Change. Although the above provides a reasonable high level summary for these 3 factors, it has two major limitations:
- By presenting treatment effects by drug class, it implies that all drugs (and all doses) within a drug class are equal, which is not true.
- The qualitative words such as "high", "intermediate", "gain" and loss" are subjective, and may be interpreted quite differently between individuals. Objective measures would be much better.
A physician does not prescribe a drug class, but rather a drug and dosing regimen, and our results show that there can be very large differences between drug regimens within a drug class. For example, the average reduction in HbA1c with lixisenatide 20 ug (7 mmol/mol) is much smaller than that with semaglutide 1.0 mg (20 mmol/mol). The weight change is also very different between these two drugs (-0.9 kg versus -4.1 kg). Hence although both are GLP-1 receptor agonists, they are clearly very different. The pharmacological differences between all drugs (e.g. in both pharmacokinetics and pharmacodynamics) will lead to real differences between all drug regimens, and the table should reflect this. One possible solution would be:
- Augment, or replace, the qualitative words such as "high", "intermediate", "gain" and loss" with quantitative values, such as "10 - 15 mmol/mol" and "2 - 4 kg", that represent the range of treatment effects across all approved dosing regimens within that class. For example:
| Efficacy 1 | Hypoglycemia 2 | Weight Change 3 | |
|---|---|---|---|
| Metformin | High 11 to 12 mmol/mol (1.00 to 1.08 %) |
Low 1.8 |
Modest Loss -0.6 kg |
| SGLT-2 Inhibitors | Intermediate 7 to 11 mmol/mol (0.62 to 0.98 %) |
Low 1.0 to 1.8 |
Loss -1.6 to -2.4 kg |
| GLP-1 RAs |
Intermediate to Very High
7 to 19 mmol/mol (0.64 to 1.75 %) 0.71 % - Albiglutide 30 mg 0.93 % - Albiglutide 50 mg 1.12 % - Dulaglutide 0.75 mg 1.29 % - Dulaglutide 1.5 mg 0.85 % - Exenatide 10 ug BID 1.15 % - Exenatide QW 2 mg 1.08 % - Exenatide QWS 2mg 1.20 % - Liraglutide 1.8 mg 0.64 % - Lixisenatide 20 ug 1.44 % - Semaglutide 0.5 mg 1.75 % - Semaglutide 1.0 mg |
Low 1.0 to 2.7 |
Loss 0 to -4.1 kg |
| DPP-4 inhibitors | Intermediate 5 to 8 mmol/mol (0.50 to 0.71 %) |
Low 1.0 to 1.4 |
Modest Gain +0.1 to +0.9 kg |
| Thiazolidinediones | Intermediate 6 to 11 mmol/mol (0.59 to 0.98 %) |
Low 1.0 to 1.5 |
Gain +1.9 to +3.3 kg |
| Sulfonylureas | High 9 to 13 mmol/mol (0.84 to 1.17 %) |
High 3.1 to 12.8 |
Gain +2.3 to +2.8 kg |
- 1 Average HbA1c reduction at 6 months (baseline HbA1c = 65 mmol/mol)
- 2 Relative Risk (versus Placebo) for documented hypoglycemia
- 3 Average Weight Change at 6 months (baseline weight = 90 kg)
The table above suggests some refinements that better reflect the real differences between drug regimens within a class (e.g. GLP-1 RAs). Also, if you 'hover' your mouse over the Efficacy cell for GLP-1 RAs, you should also see results for individual drug regimens. Another alternative would be to simply present results by individual drugs directly in the table (space permitting). We hope we can work with the ADA to improve Table 9.1 !!
This website uses a number of advanced features that may not work on older web browsers. We have tested the following:
-
Chrome 68 (best performance)
-
Safari 10.1.2
-
Firefox 61.0.2
-
Opera 54
-
Internet Explorer 11 (OK, but not great)