Welcome to our new Cardiovascular Outcomes Section!
Cardiovascular (CV) outcome trials are now an integral part of the clinical development plan for all new type 2 diabetes drugs. Initially designed to rule out an increased risk of CV events (in light of negative post-marketing data with rosiglitazone), a number of recent trials how managed to demonstrate reductions in CV risk, notably the SGLT2 inhibitors (e.g. empagliflozin, canagliflozin) and some GLP-1 RAs (e.g. liraglutide, semaglutide, albiglutide).
Since these trials are so important, expensive and long, it makes sense to fully investigate how best to design these trials. That is, beyond the drug regimen, what other factors could potentially influence the probability of success of the trial? Thus 16 trials, representing over 157 000 patients, have been collated, digitized and re-analysed. In Figure 1 below, the Kaplan-Meier (KM) graphs for each trial are shown for the 3 point MACE (Major Adverse Cardiovascular Events (note: ELIXA is 4 point MACE)). This definition includes cardiovascular death, nonfatal myocardial infarction, and nonfatal stroke. The estimated Hazard Ratio (95% CI), the total number of events ("E=") and total sample sizes ("N=") for each trial are also shown.
Figure 1
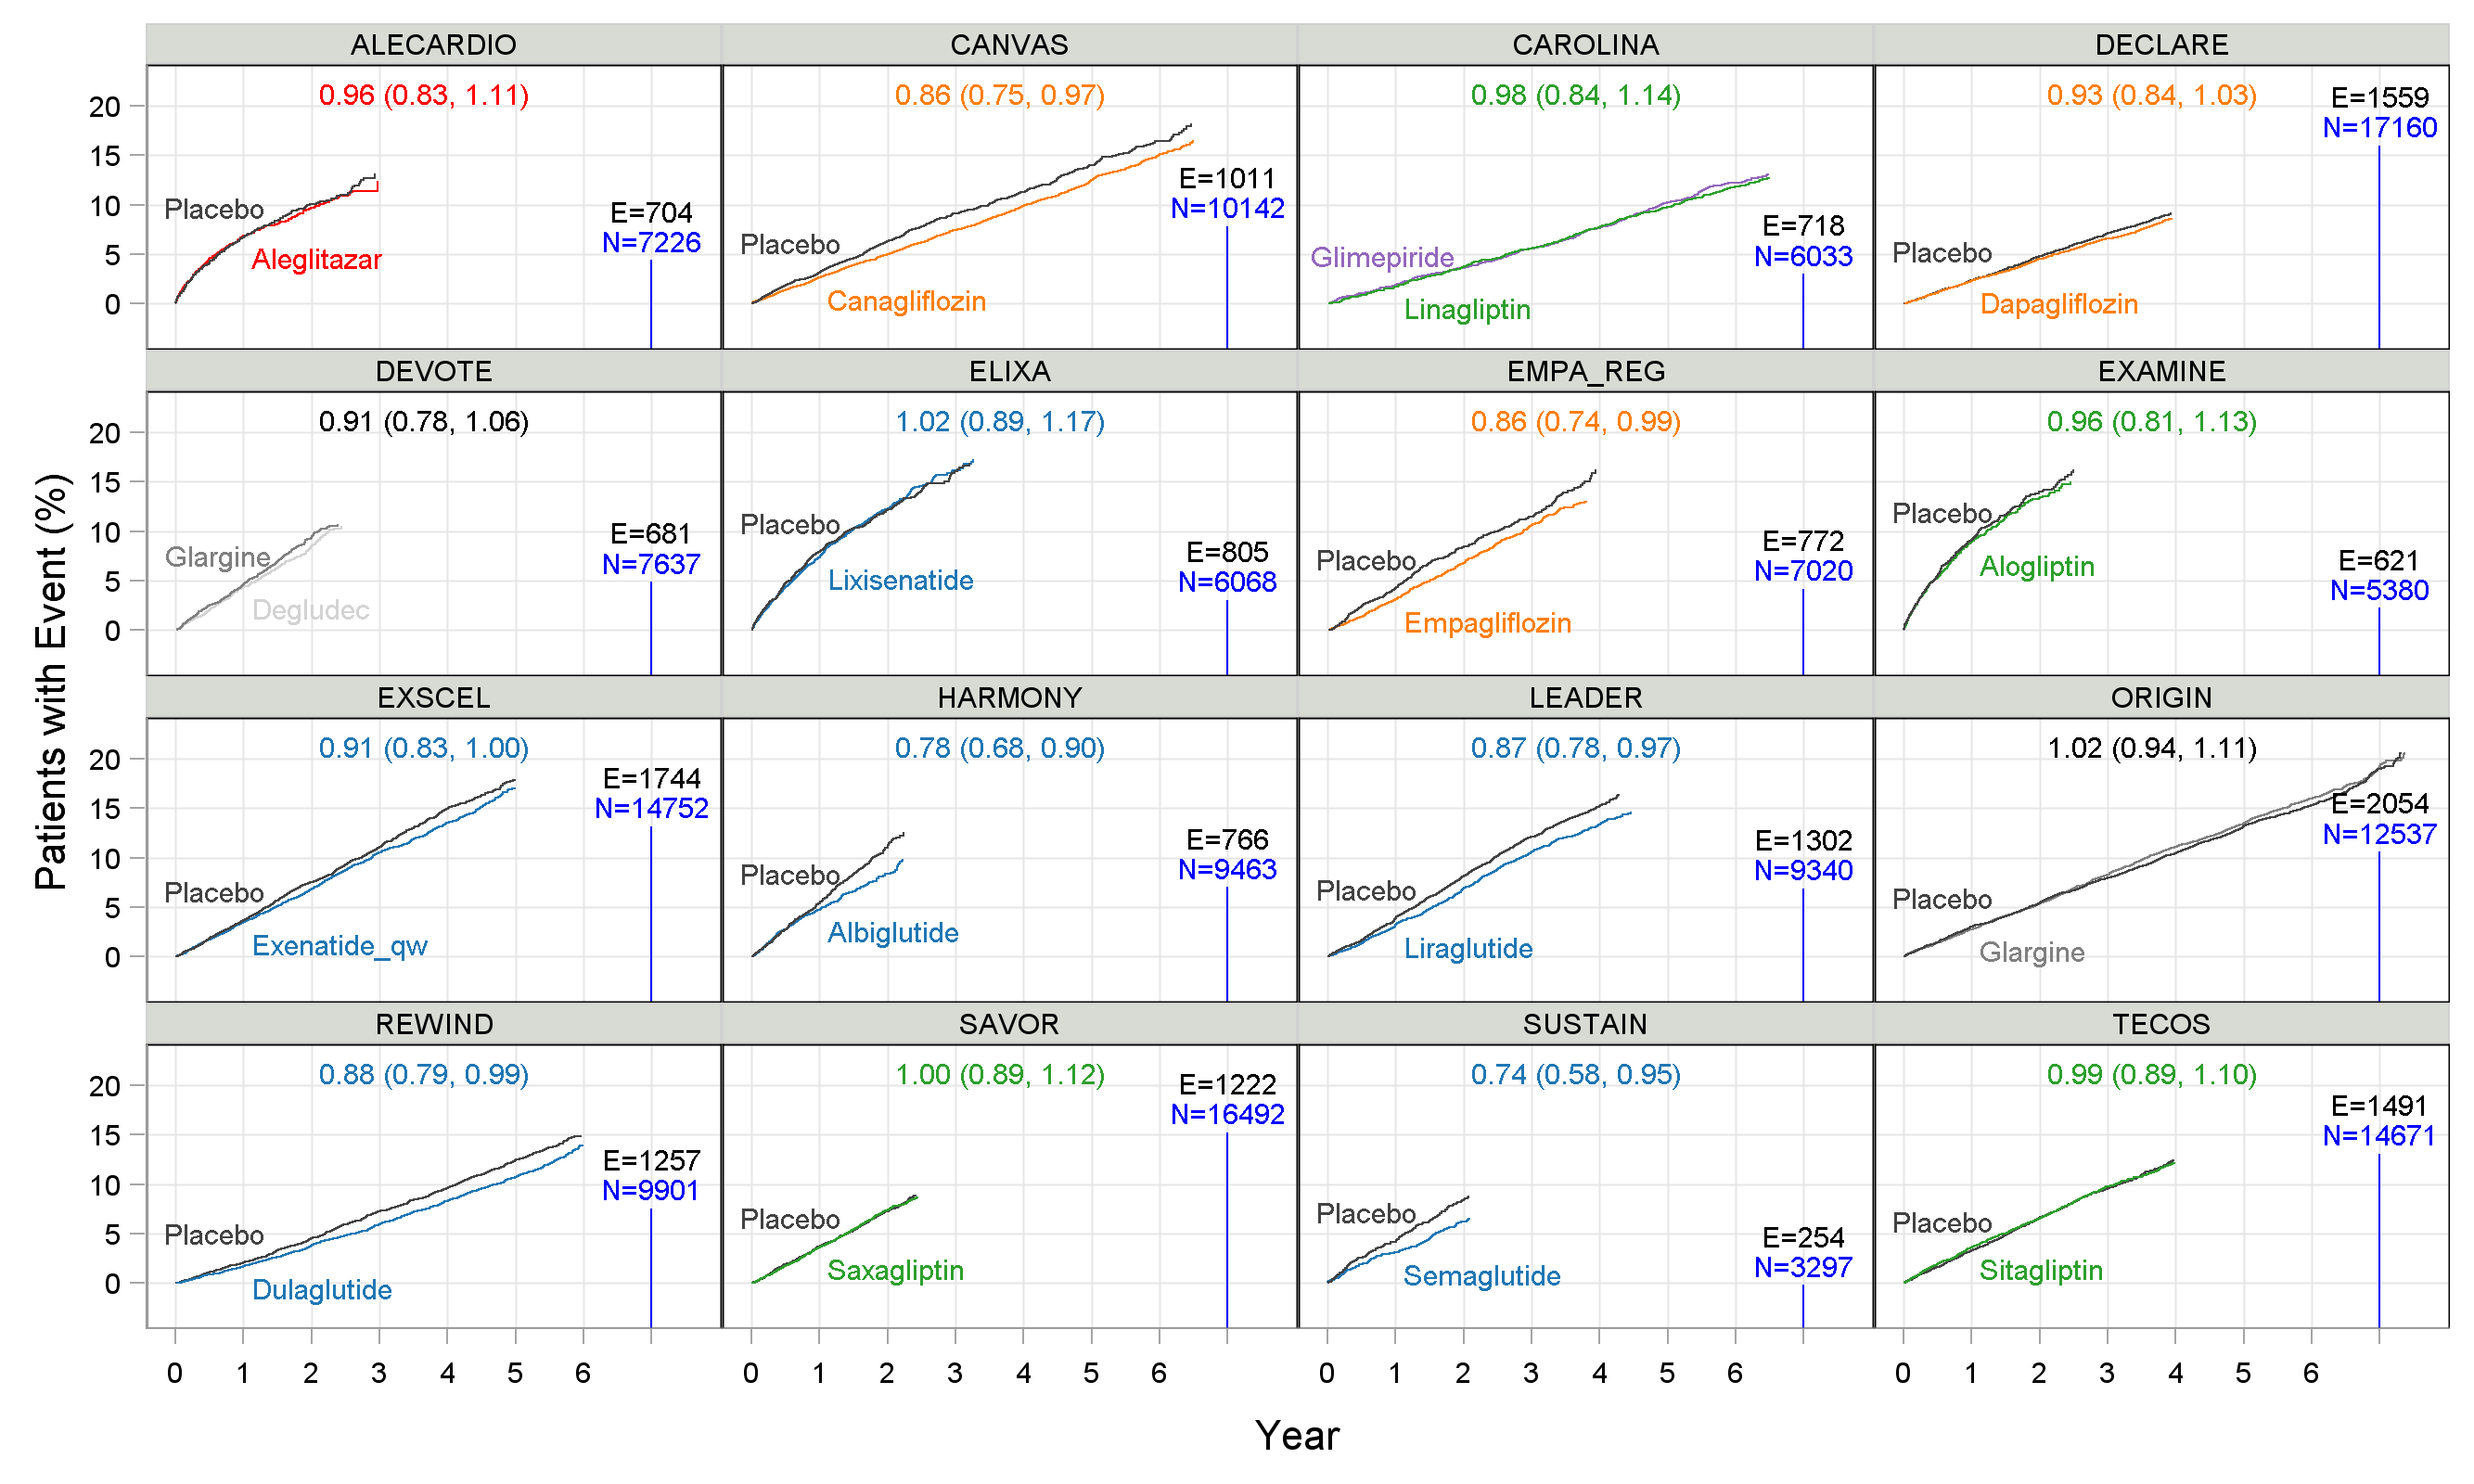
Before discussing the treatment effects, it is important to note that the maximum follow up duration ranged from around 2.25 years (SUSTAIN) to 7 years (ORIGIN), total sample sizes ranged from 3297 patients (SUSTAIN) to 17160 patients (DECLARE), and total events ranged from 254 (SUSTAIN) to 2054 (ORIGIN) events. What is the rationale for these differences? In particular, we could ask "What trial design (number of events, patients and follow up duration) is optimal?". In short, some trials are likely to be too large and long, while others may be too small and short; they cannot all be optimal, so there is clearly room for refinement/ improvement in these trial designs.
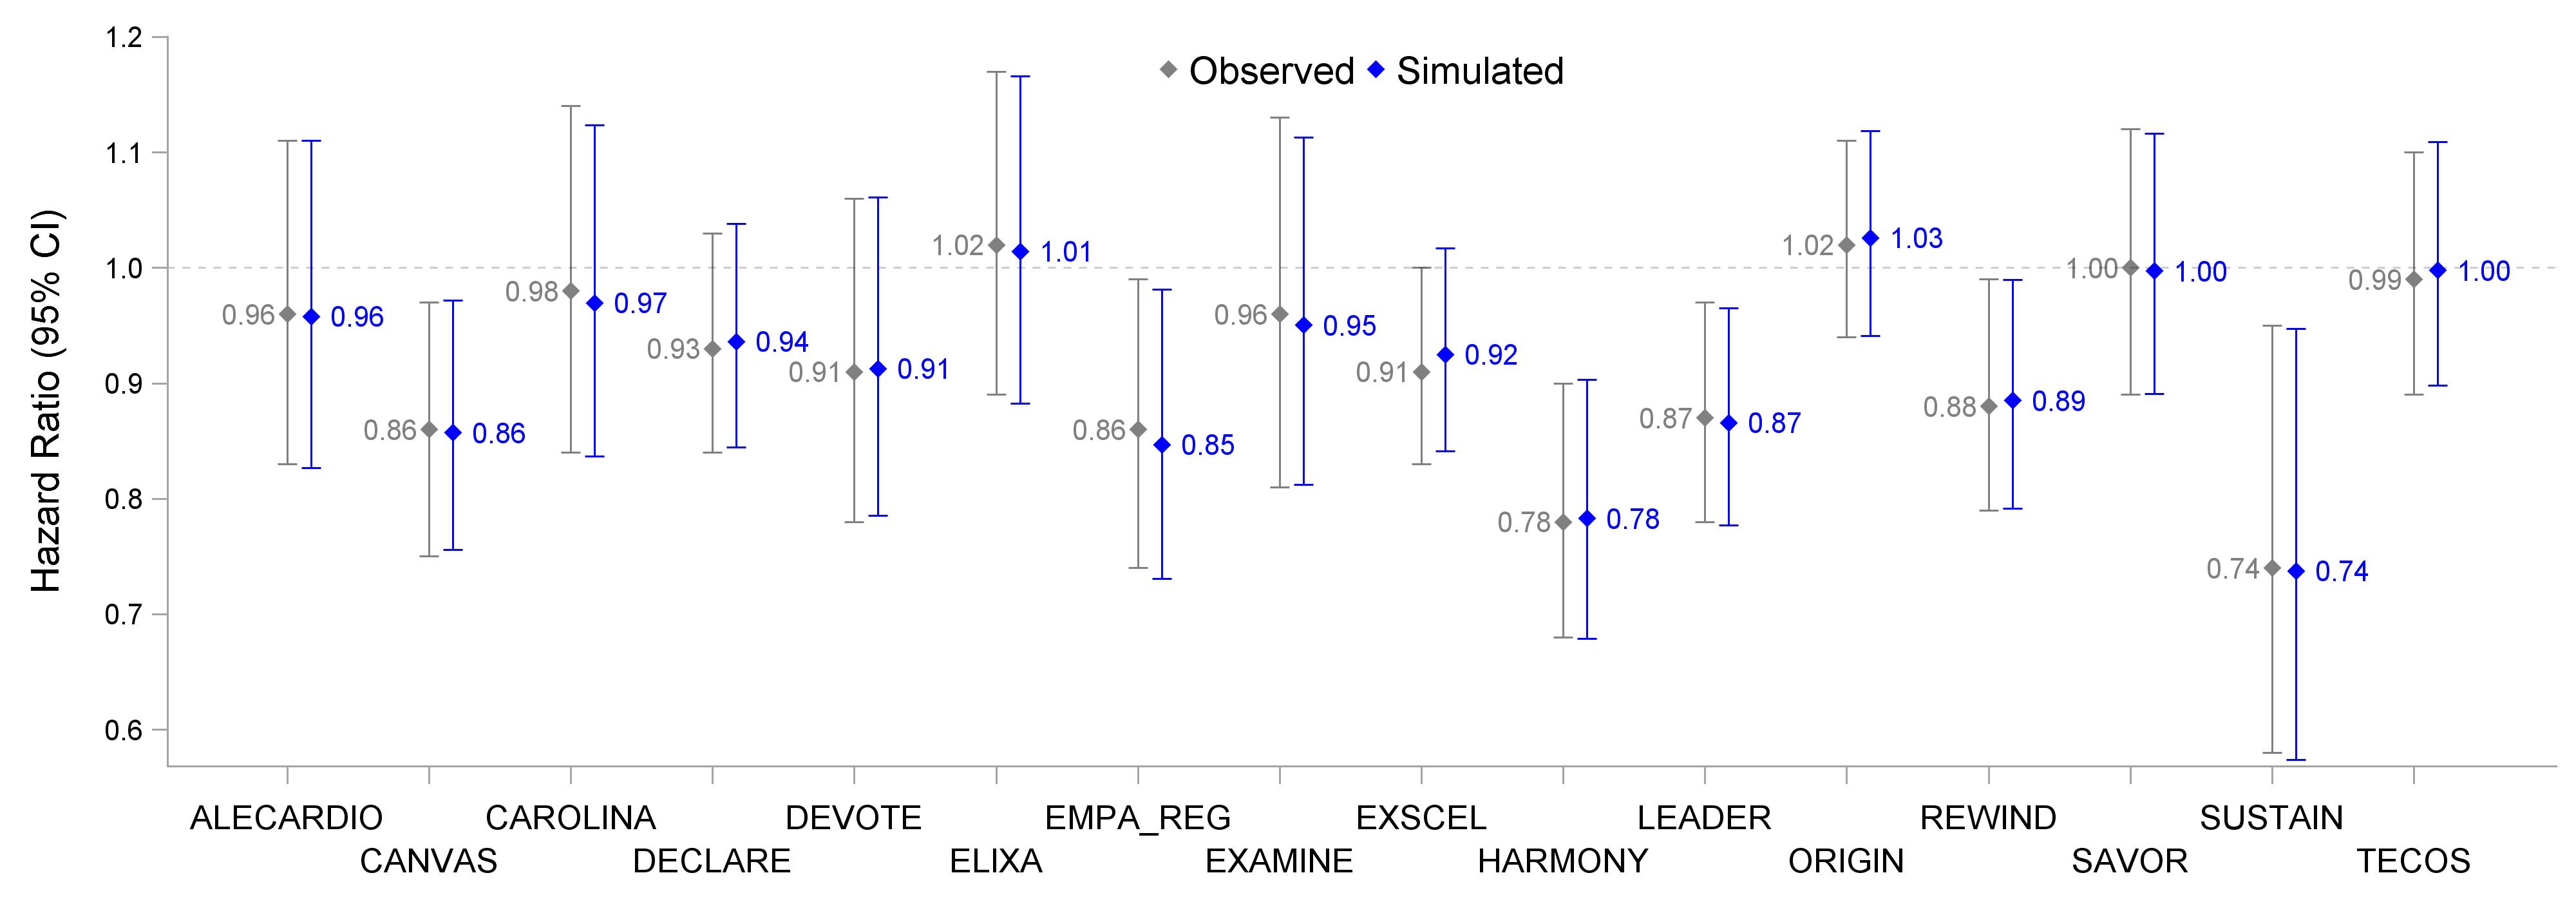
In these trials a standard Cox proportional hazards model was used as the primary analysis method (yielding a HR and 95% confidence interval (CI)). For example, in EMPA-REG, the HR (95% CI) for empagliflozin versus placebo was 0.86 (0.74,0.99). This can be equally stated as a relative risk reduction of 14% (1%, 26%). The observed HR (95% CI) for all trials are shown in Figure 2 below, alongside the results based on a simulated dataset for each trial. These simulated datasets are "reverse engineered" to be a very accurate approximation of the observed data, and contain all key details of events and censoring information to allow further re-analysis. As can be seen from the figure, the simulated datasets generate results that are very similar to the original reported results (indeed, the KM graphs based on the simulated data are indistinguishable from the observed KM graphs).
Figure 2
We are now in a position to explore the data beyond the simplistic Cox PH model. Indeed, the basic assumption of this model is that the HR is constant over time, which is rarely every going to be wholly true. Thus we can ask, how does the estimated HR change depending on the maximum follow up duration? This is shown in Figure 3 below for each trial, and can help identify when the treatment effects are likely to be largest.
Figure 3
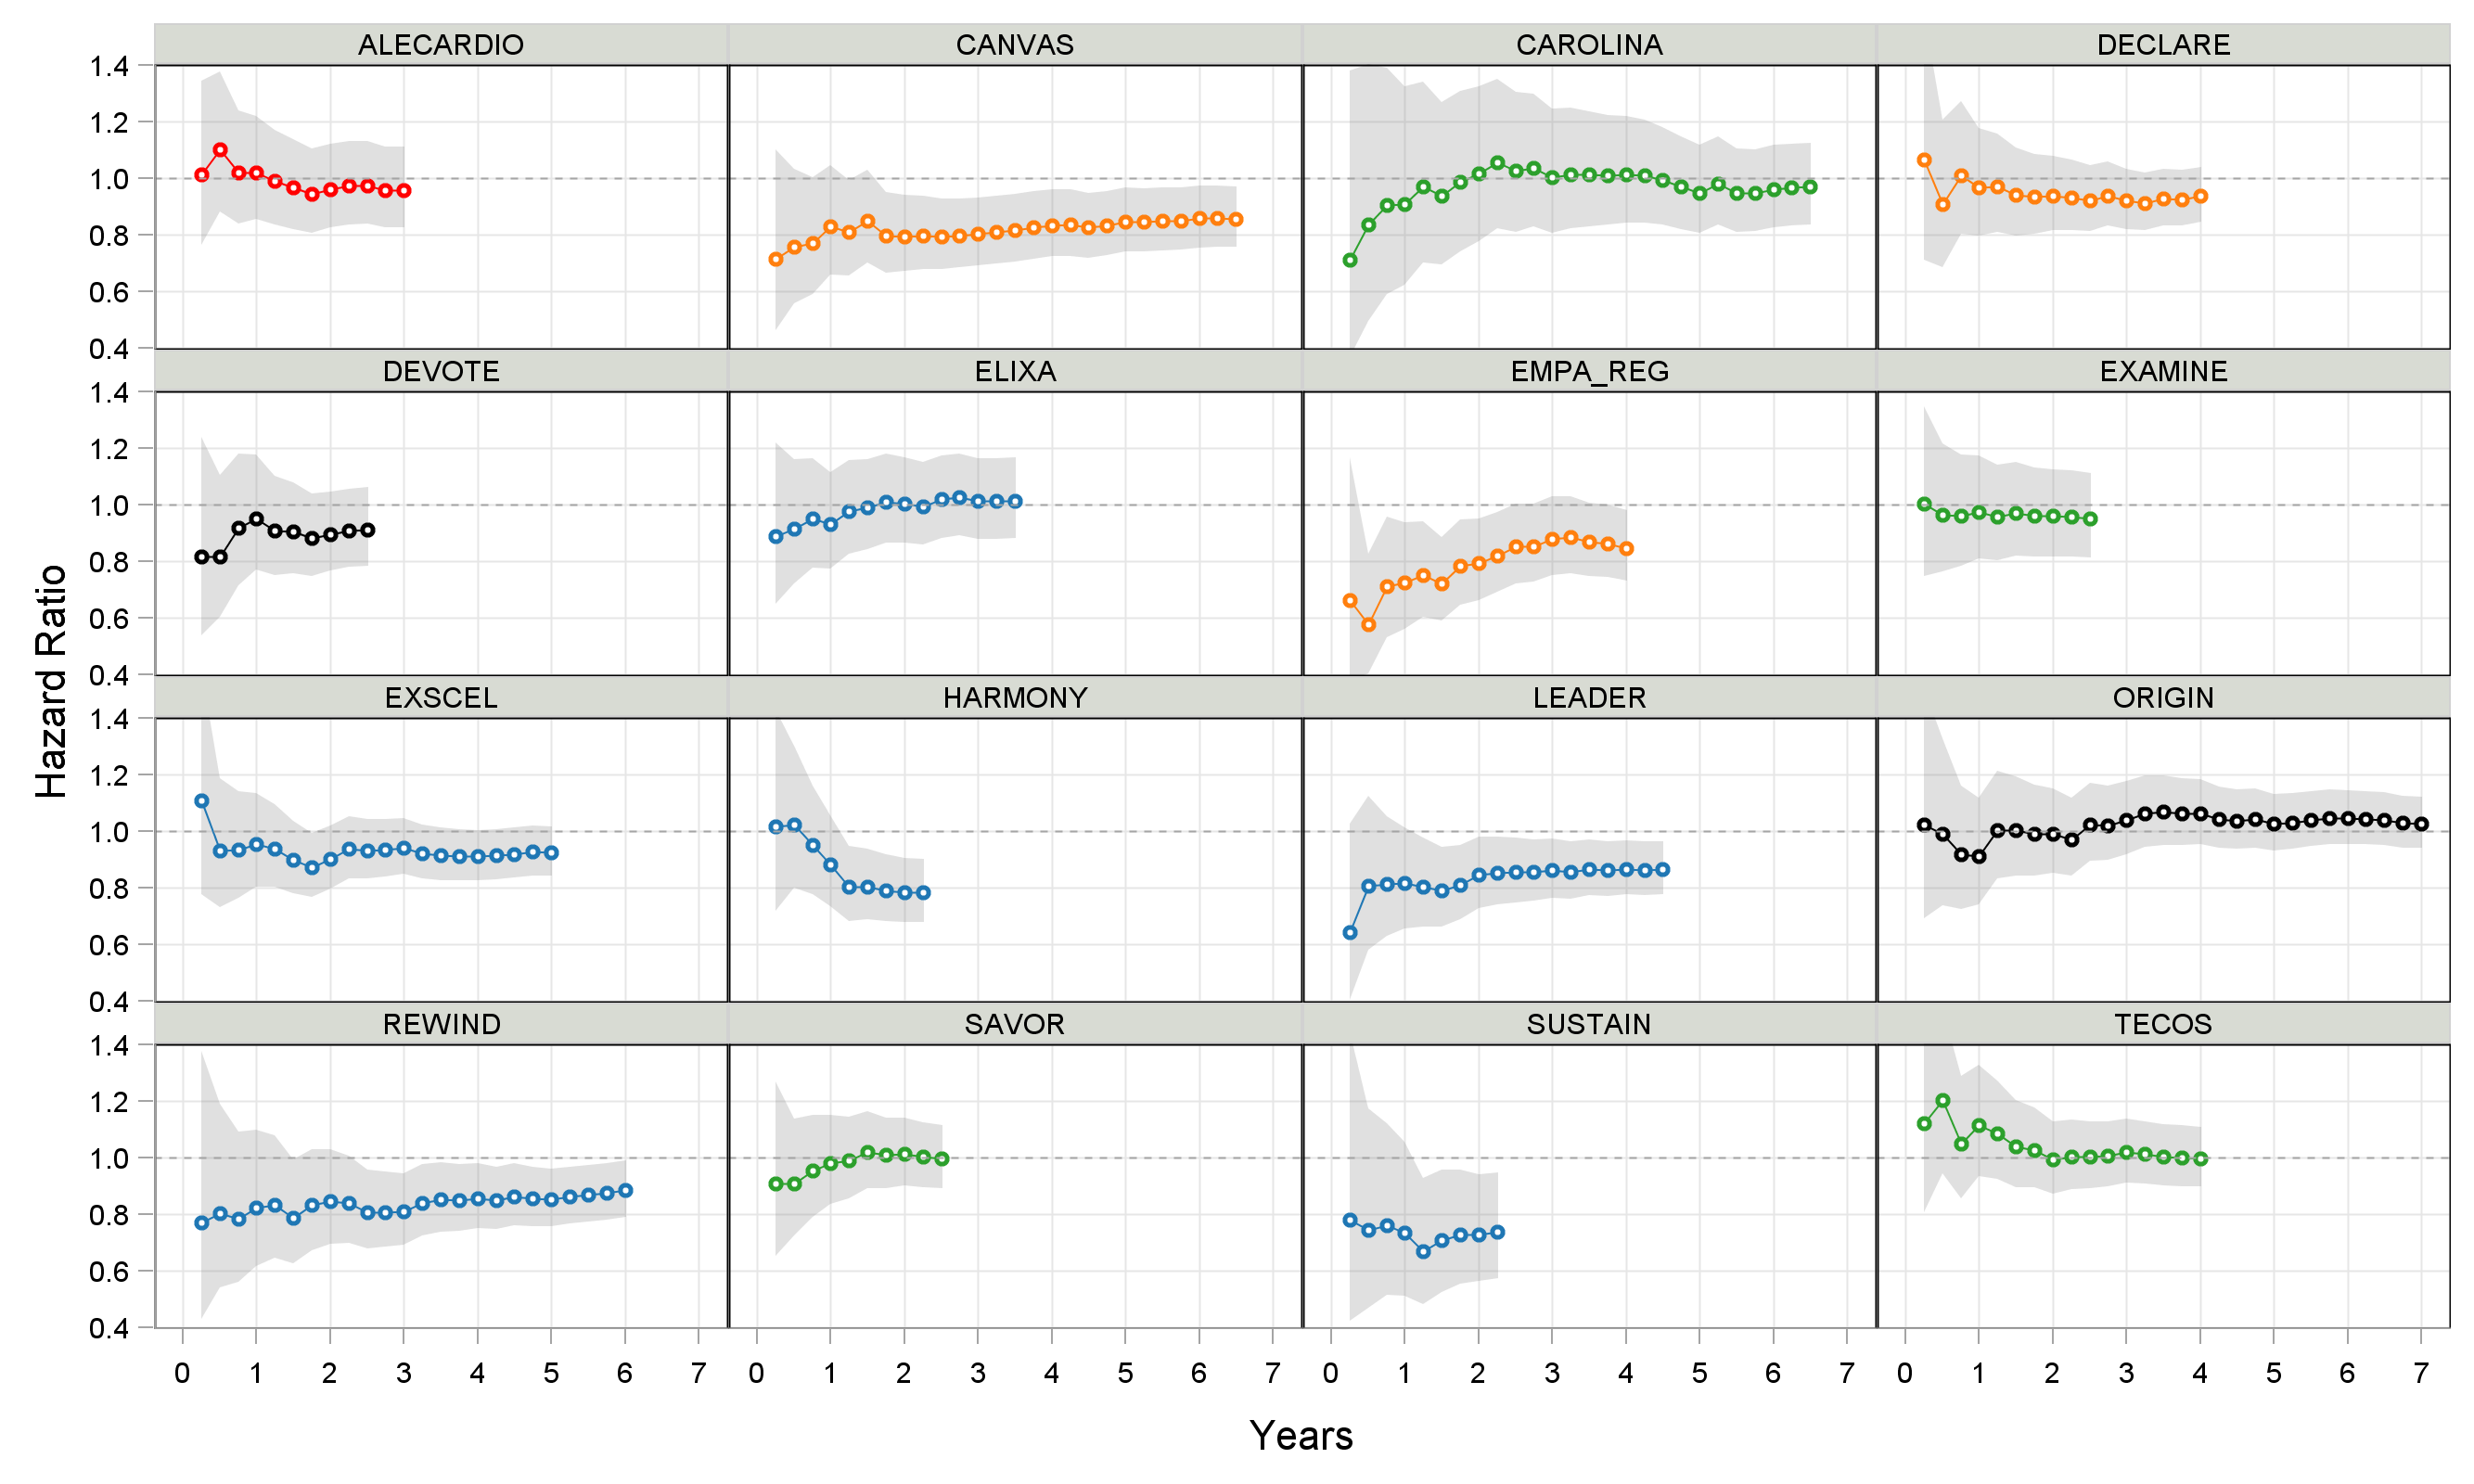
Many observations can be made from this simple figure. For example, in the seminal EMPA-REG trial with empagliflozin, the greatest relative risk reduction is observed near the start of treatment. Indeed follow up durations longer than 2-3 years in trials like REWIND (dulaglutide) and CANVAS (canagliflozin) actually provide limited additional value, but would substantially extend the trial duration/cost. An animated version of these results is shown below (click the "Re-Run Animation" button at the top...many thanks to the kind folk at Flourish).
In this short overview, two final observations. Firstly, Figure 4 shows the Annualised Event Rate over time across trials (this is similar to the 'slope' of the KM curves). To aid a visual comparison, the placebo treatment arms from all the other trials are shown in light gray on each panel.
Figure 4
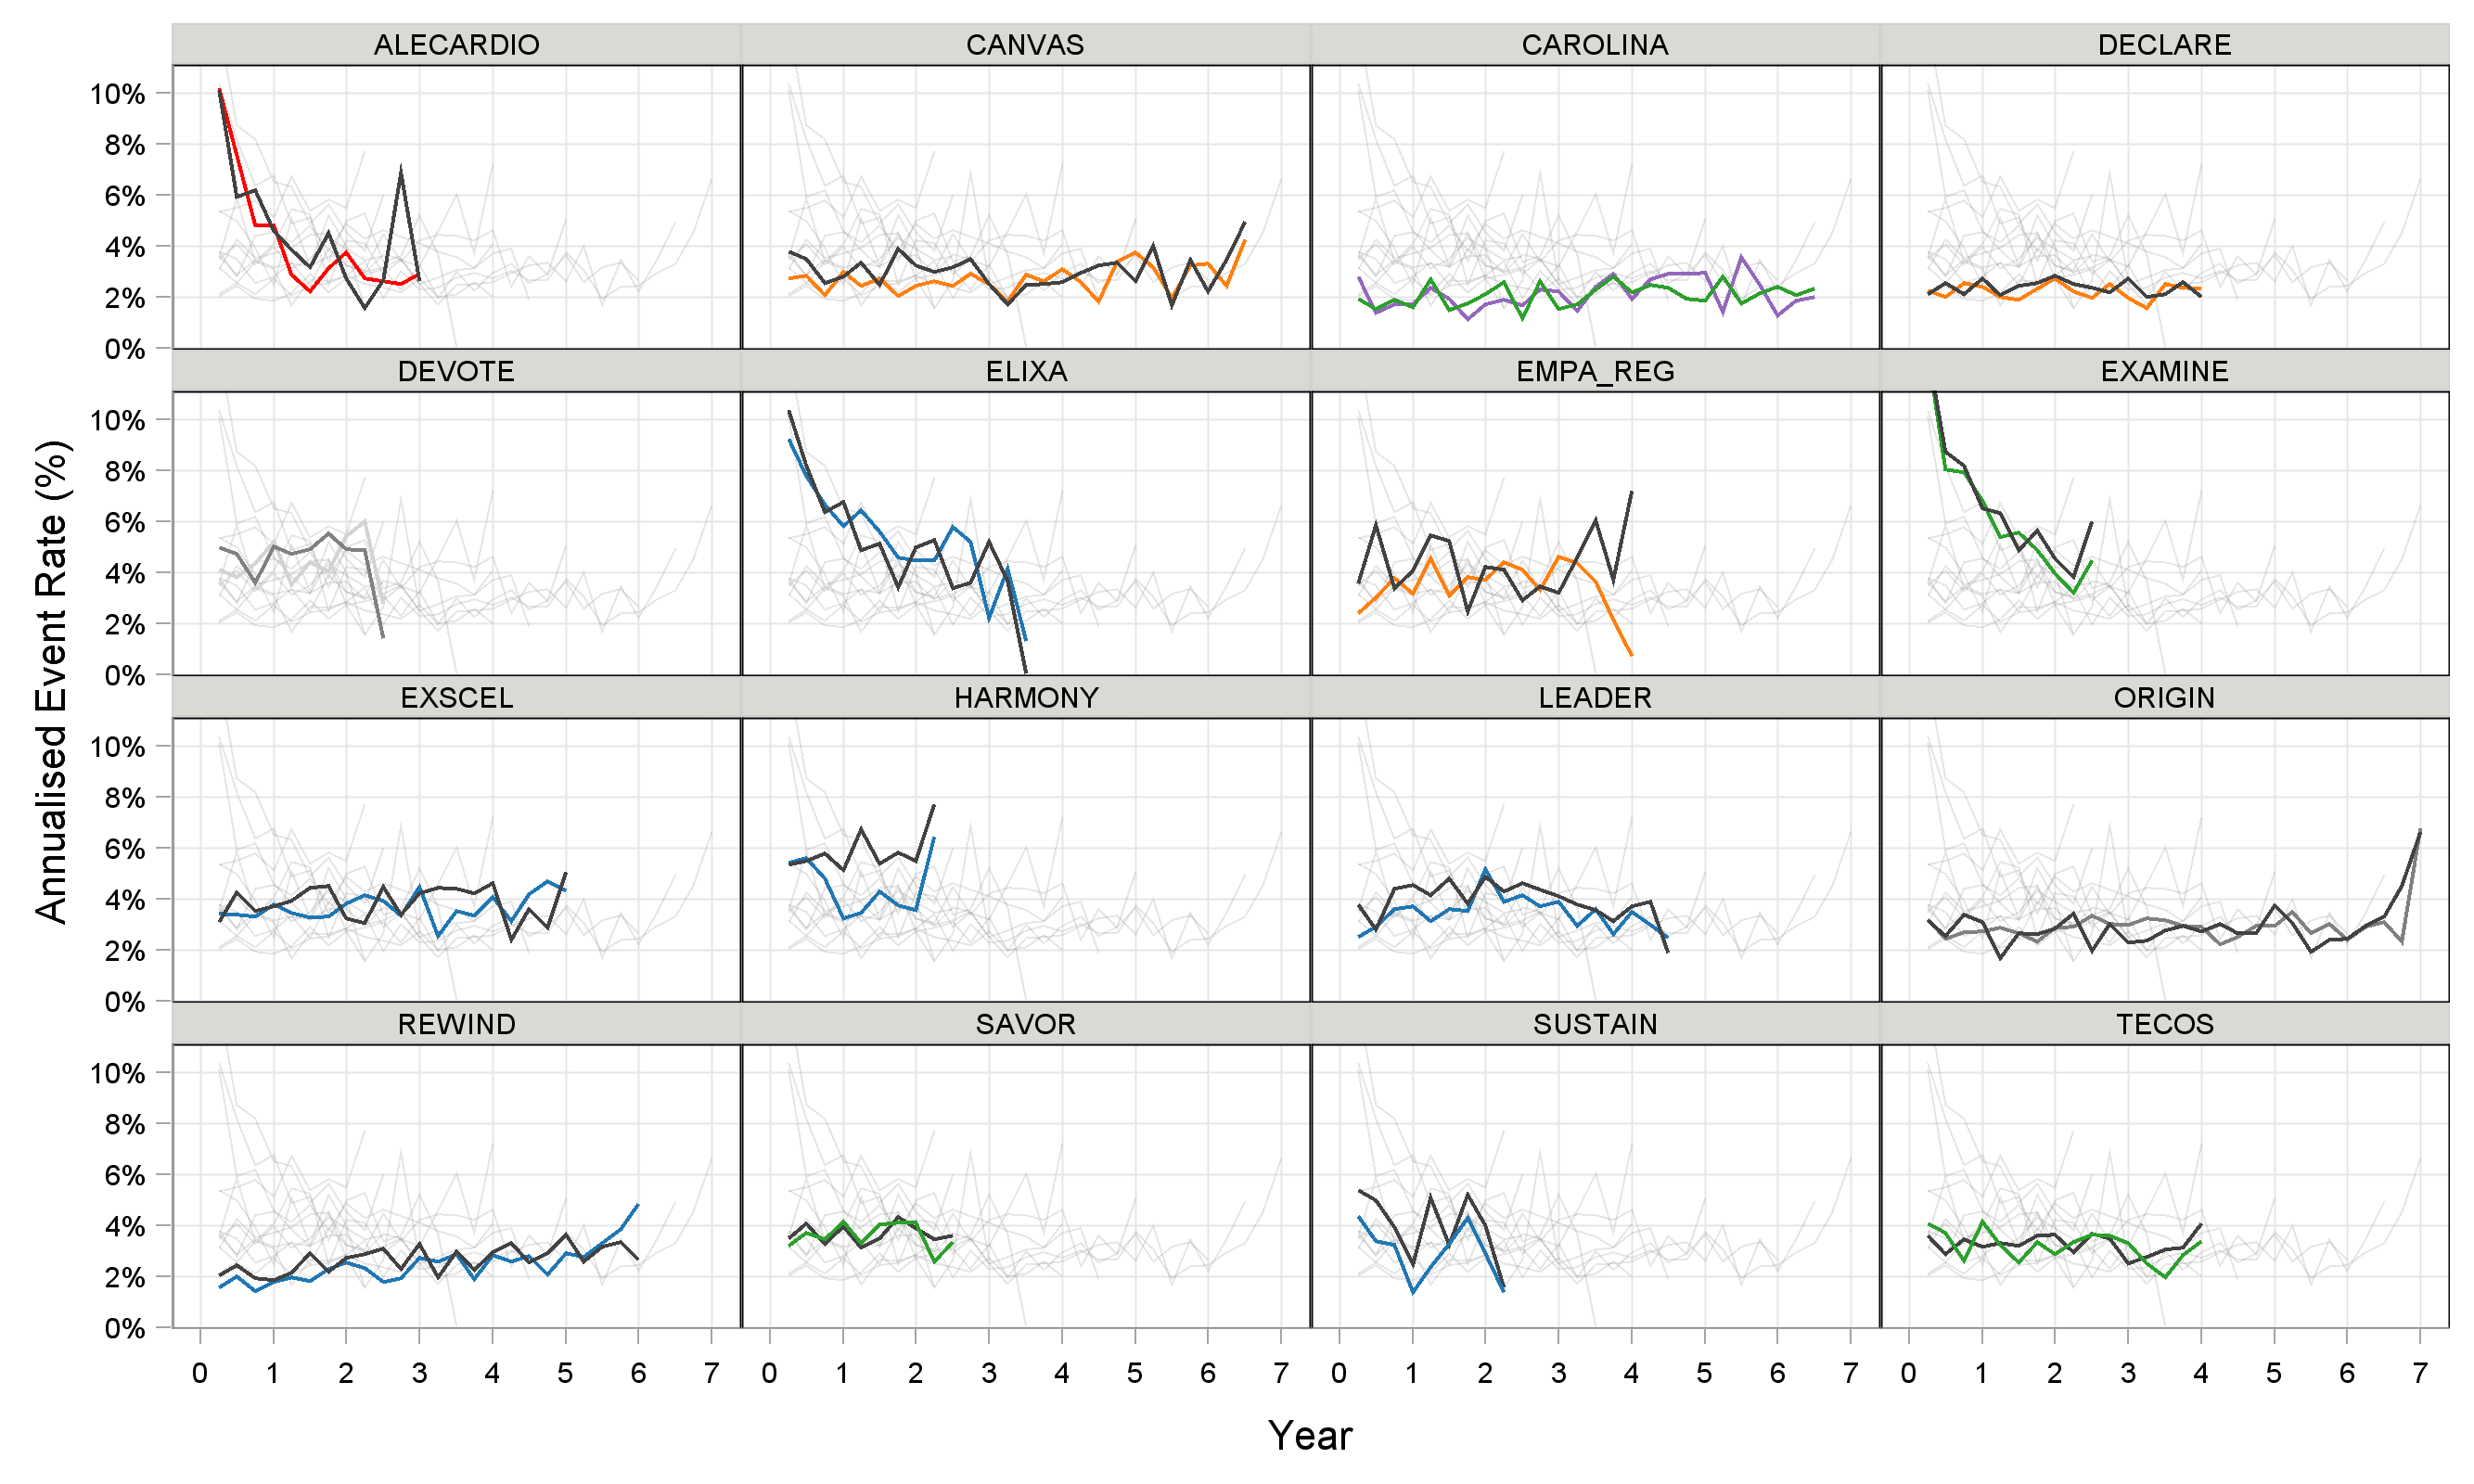
Here we see that trials with low event rates, such as REWIND (dulaglutide) and DECLARE (dapagliflozin) were also trials where the observed hazard ratios were rather disappointing relative to similar drugs (e.g. compare with HARMONY (albiglutide), SUSTAIN (semaglutide) and EMPA-REG (empagliflozin)). This highlights the potential inter-relationship between the inclusion criteria for the patient population (=driving the event rate), and the magnitude of the resulting treatment effects.
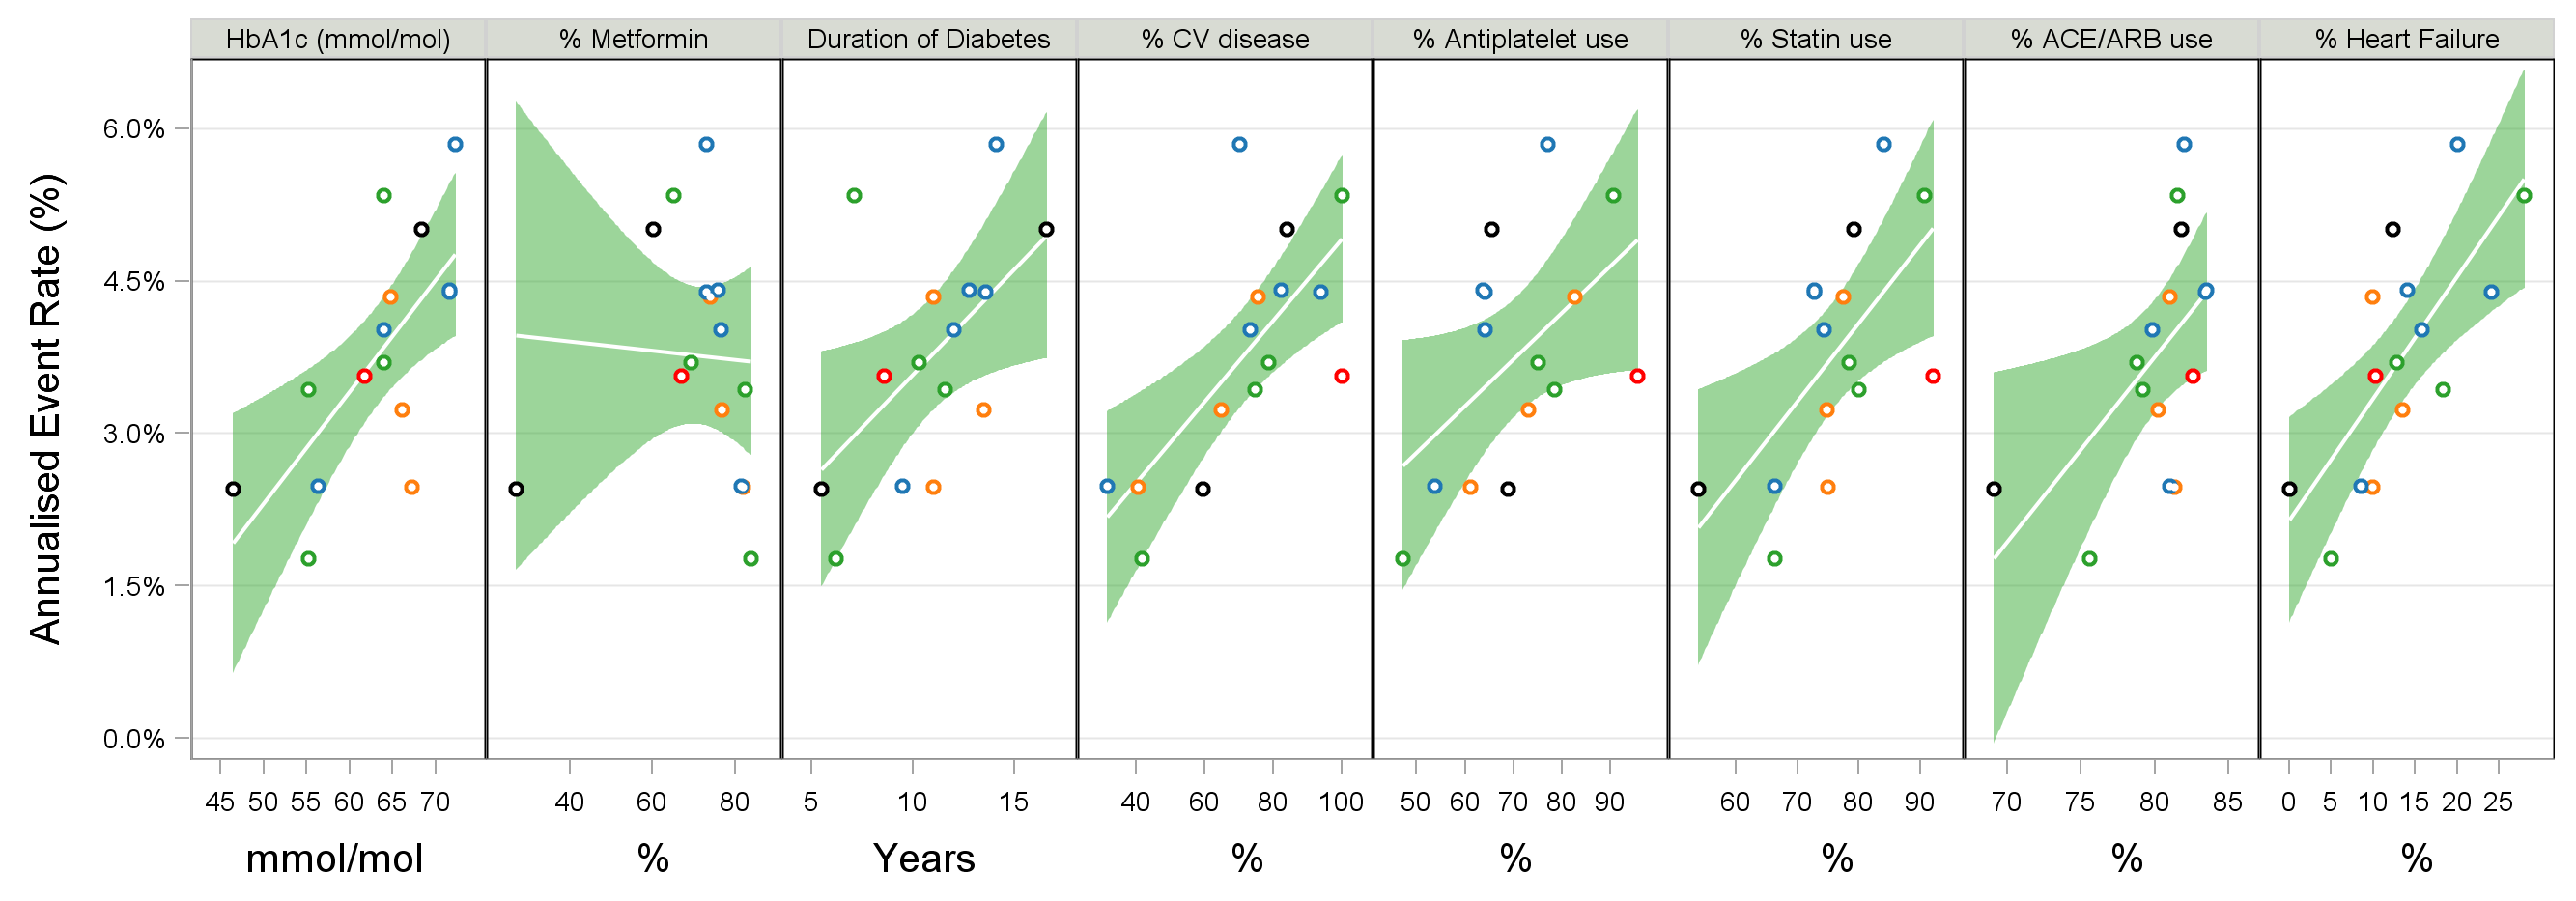
Secondly, it can be enlightening to consider how the baseline characteristics of the patient populations in each trial could influence the observed event rate. Figure 5 shows the Annualised Event Rate versus selected baseline covariates for the placebo treatment arms. Although care needs to be taken in interpreting these results (given the multi-dimensional nature of the data), a thorough investigation of this data could help better define the best patient population, leading to improved trial design, conduct and better trial outcomes (=higher probability of success).
Figure 5